

Are you worried that today’s higher costs are going to lead to a big wave of foreclosures because homeowners will struggle to make their mortgage payments? Here’s what you need to know.
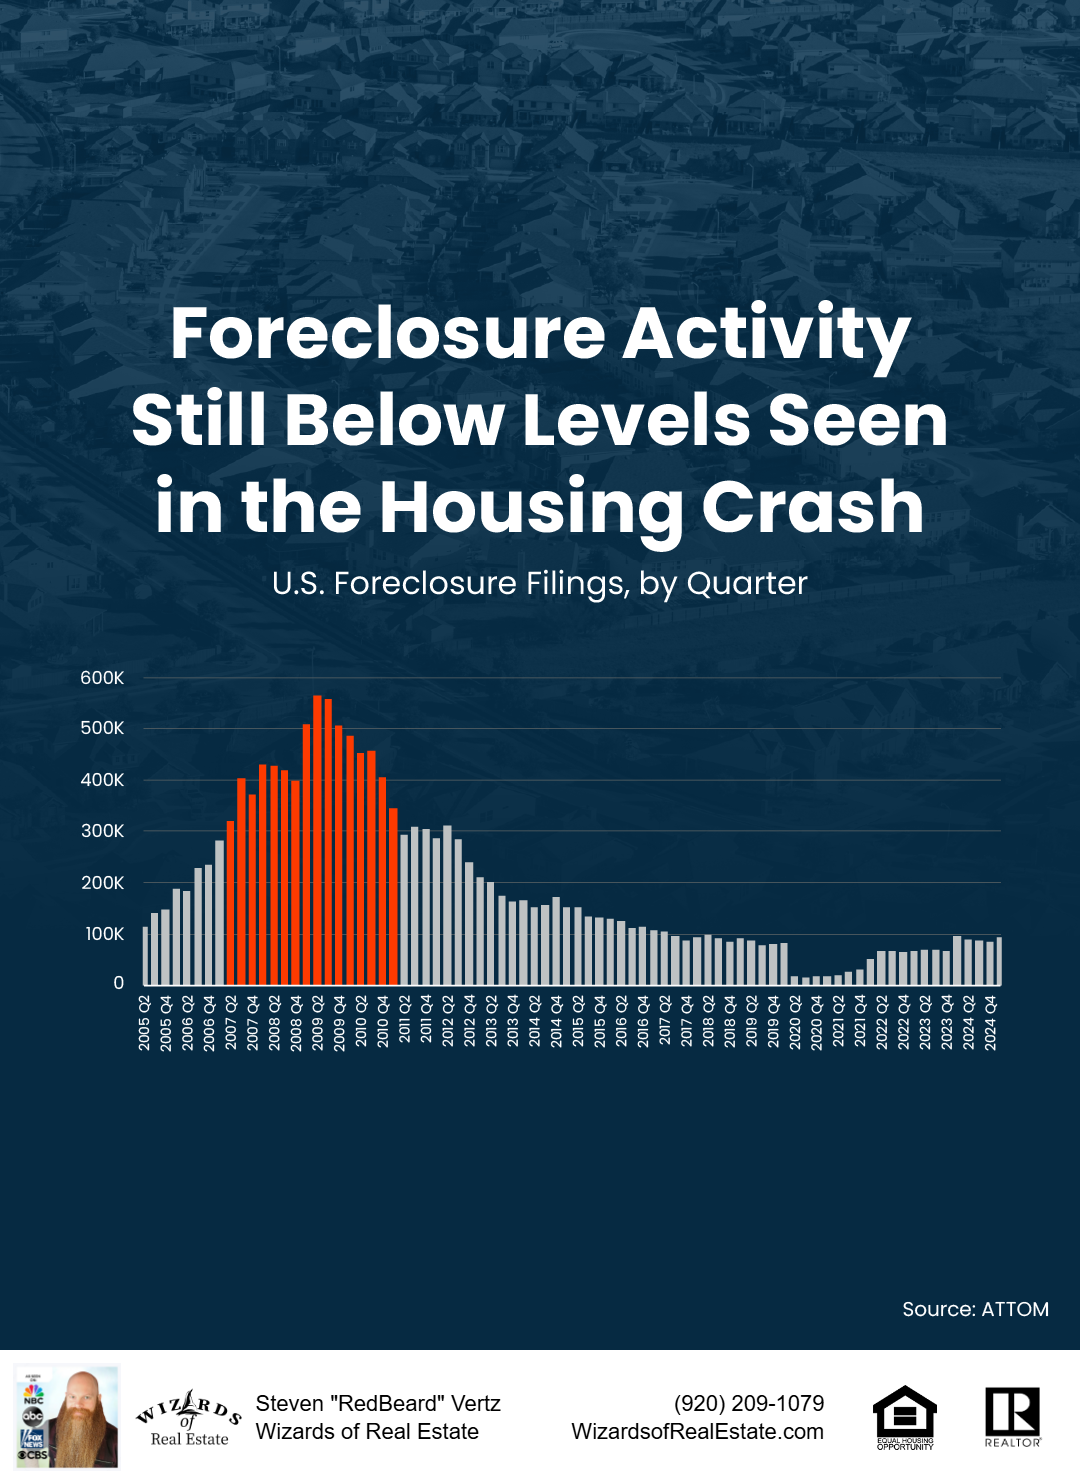
While it’s true foreclosure filings may be up slightly, data shows they’re nowhere near 2008 levels. And here’s some more context you may not have heard. Unlike last time, most homeowners now have a lot of equity.
That creates a financial cushion that helps give them options to avoid foreclosure.
If you have other questions about what you’re seeing or hearing about the housing market, contact me today!
Post a comment